Workforce Intelligence
See where your team's capacity actually goes.
Optimetrix turns real work-activity into utilization, focus-time and workload analytics — so you plan the next hire, the next sprint and the next office decision on data, not gut. Metadata only. No screenshots. The same dashboard your team sees.
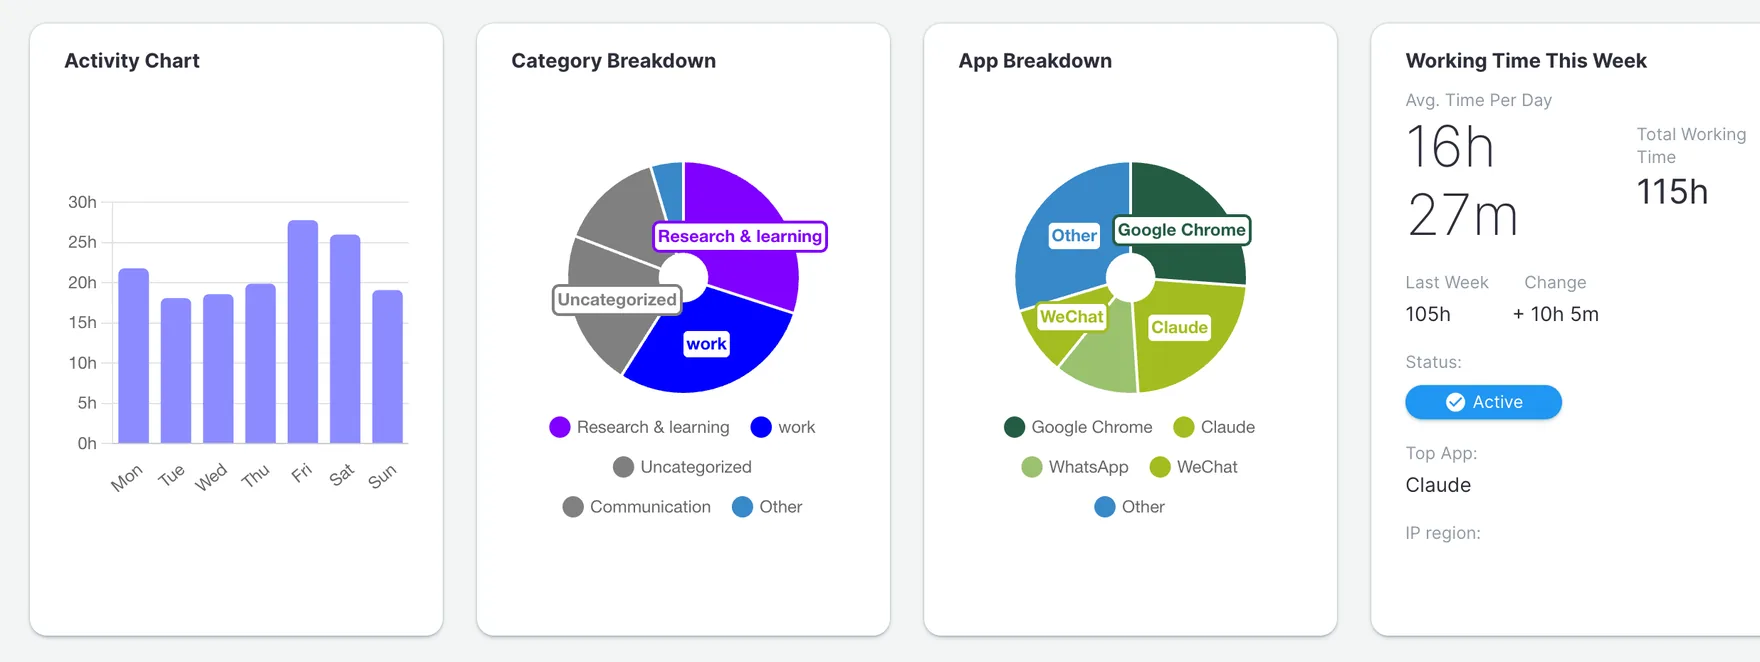
Sample workspace. Aggregated metrics only — every figure an employee sees is the same one their manager sees.
Leaders plan capacity blind.
Timesheets lag a week and get rounded to the nearest half hour. Slack activity shows who answers fastest, not who has room. So hiring, deadlines and hybrid policy get decided on a feeling.
Where the overload is
Which teams are already past their limit — before someone burns out or quietly starts interviewing.
Where capacity sits idle
The 20 points of utilization hiding inside a healthy-looking team average.
Where the week actually goes
Focus-time versus meetings versus coordination — by team, measured, not estimated.
How it works
A lightweight agent. Metadata only. Analytics you can act on.
Agent install
A background app for Windows, macOS and Linux. Deploys through your MDM. No system load, no user setup.
Metadata only
Active application, window title, category and time. No screen recording, no keylogger, no access to files, chats or email.
Analytics
Encrypted to your server — on-premise or cloud. Utilization, focus-time and workload roll up by person, team and category.
The dashboard
Workforce analytics: utilization, focus-time and workload in one place.
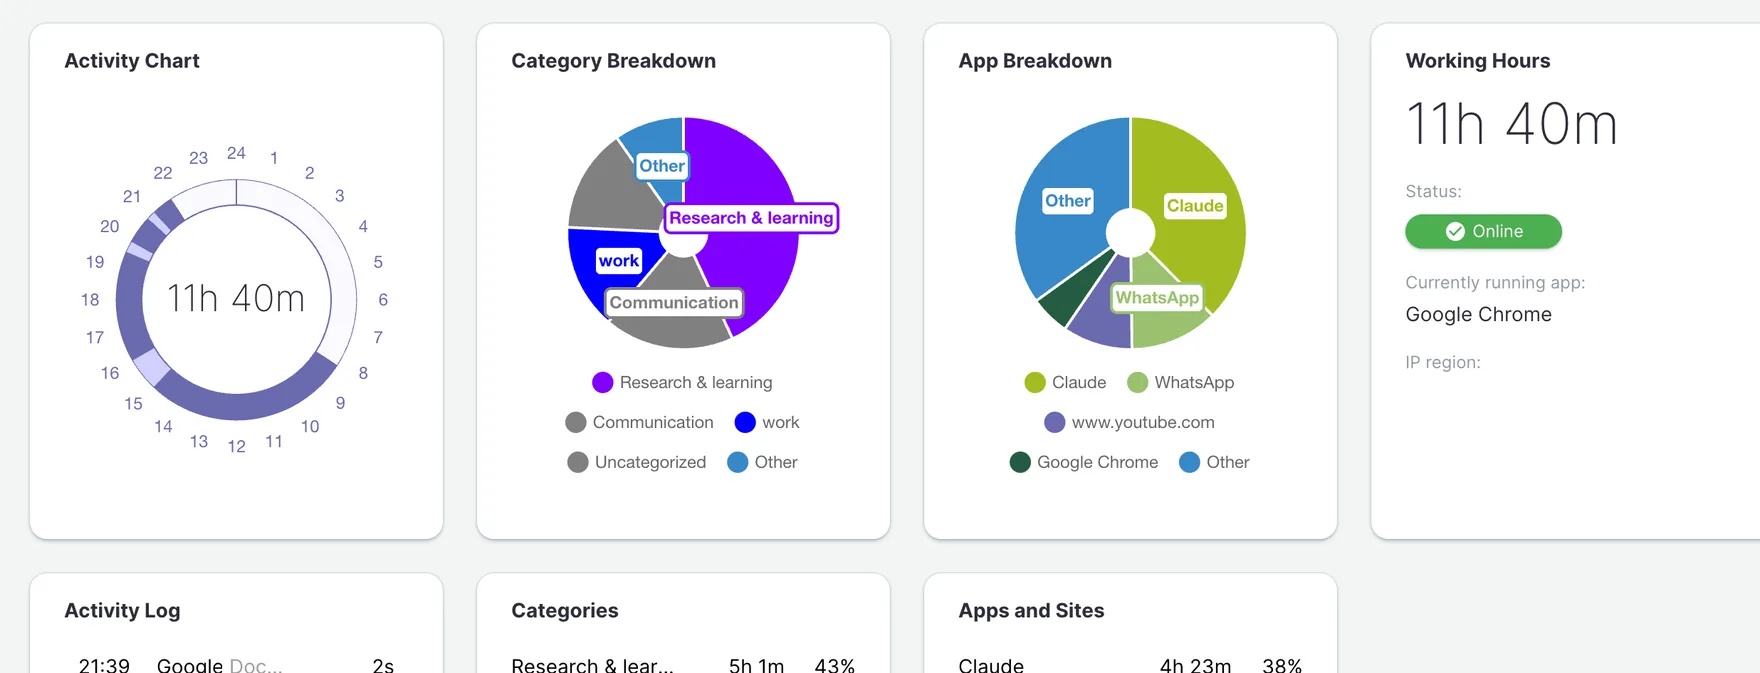
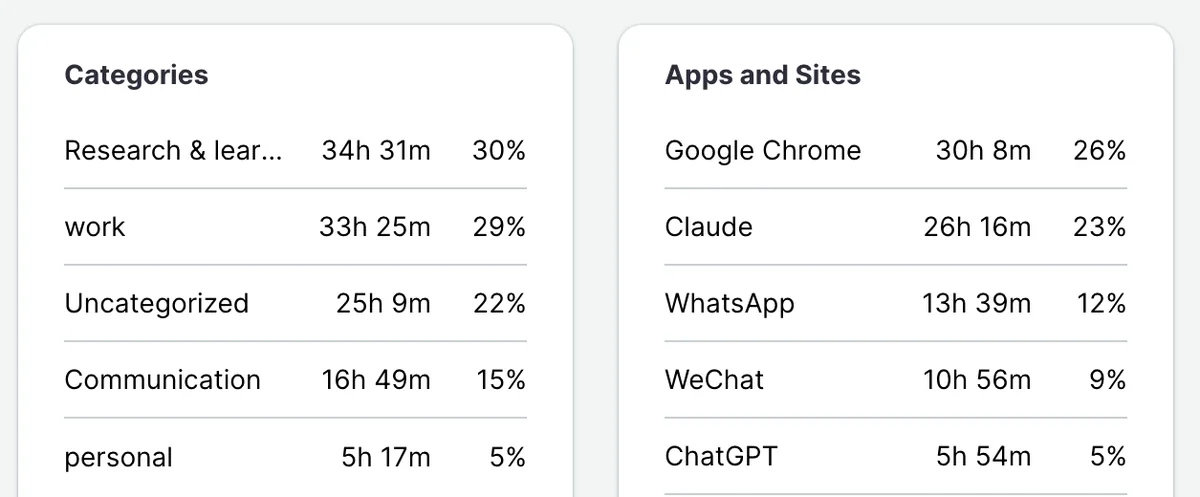
Real activity, categorized into the kinds of work your teams actually do. Roll it up by week or drill into a day. New to the category? Start with what workforce analytics is.
Utilization & trend
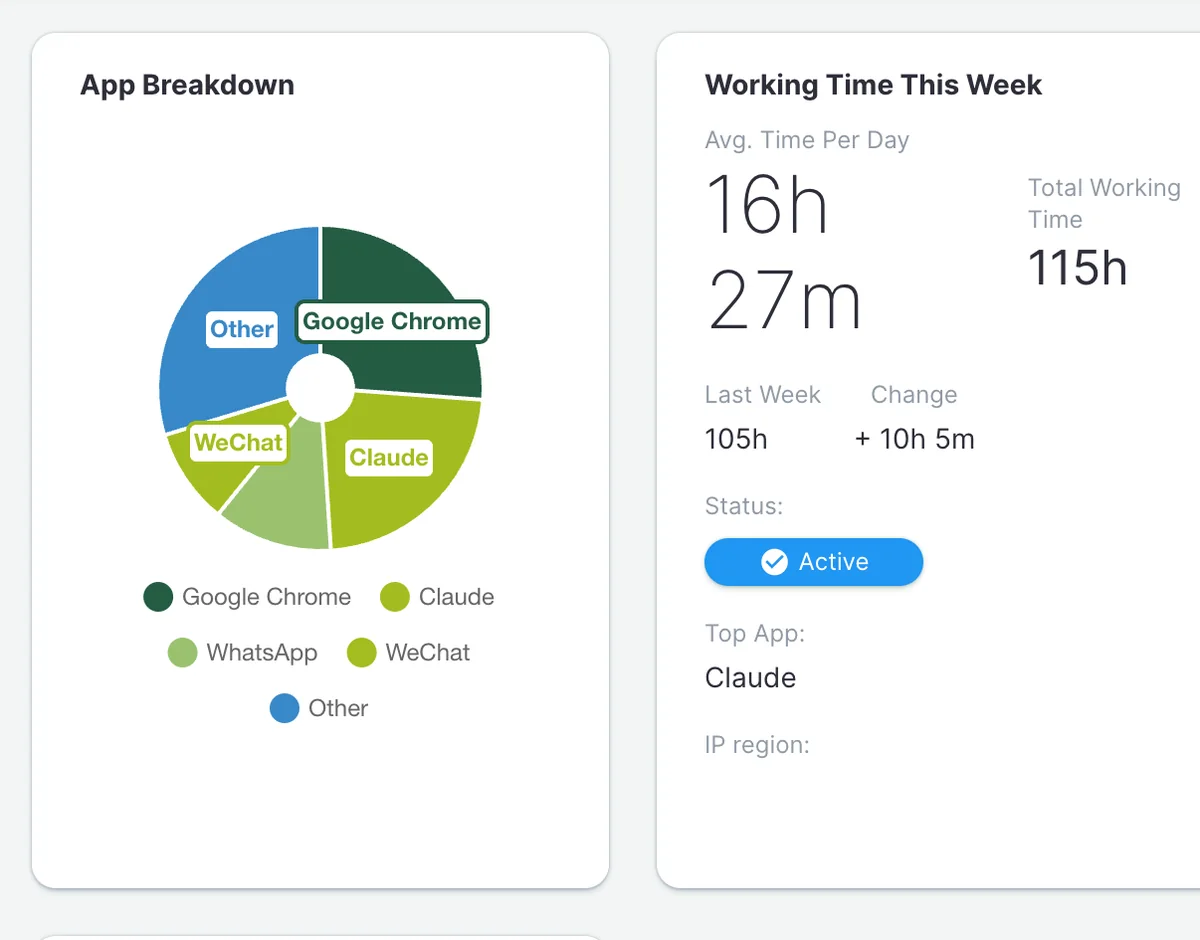
Average per day, weekly total, and the change against last week — per person and per team.
Where the time goes
Category and application breakdowns — focus work, communication, research, and the rest.
Shape of the day
Activity by hour and by weekday — so overload and idle capacity are visible before planning.
Analytics for planning — not a control tool.
Optimetrix shifts the question from who is working to where the capacity is. Employees and leaders see the same numbers and the same rules.
What it is
- A planning instrument — find bottlenecks, balance load, size the next hire.
- Objective numbers instead of a subjective read of who looks busy.
- A base for fair, transparent assessment — same dashboard for everyone.
What it isn't
- No webcam, no periodic screenshots.
- No reading chats, email or documents.
- No keystroke logging, no passwords, no private life.
Who it's for
Built for the people who plan the work.
Professional services & agencies
Utilization by person and by team, updated daily. See billable leakage and the spread between an over-booked team and an idle one — before it hits margin.
Distributed operational teams
Capacity, focus-time and meeting load across offices and time zones. Make return-to-office and headcount calls with a baseline instead of a debate.
Also used by BPOs and contact centers, MSPs, accounting and legal teams, and remote-first product organizations.
Start with a two-week pilot.
We deploy the agent, configure your teams and categories, and hand back your first workforce readout within the first week. On-premise or cloud.
Or email info@optimetrixlab.com